In This Project I used Excel to build an interactive dashboard analyzing Adidas sales performance across the United States for 2020–2021,
with insights by product category, region, retailer and sales method.

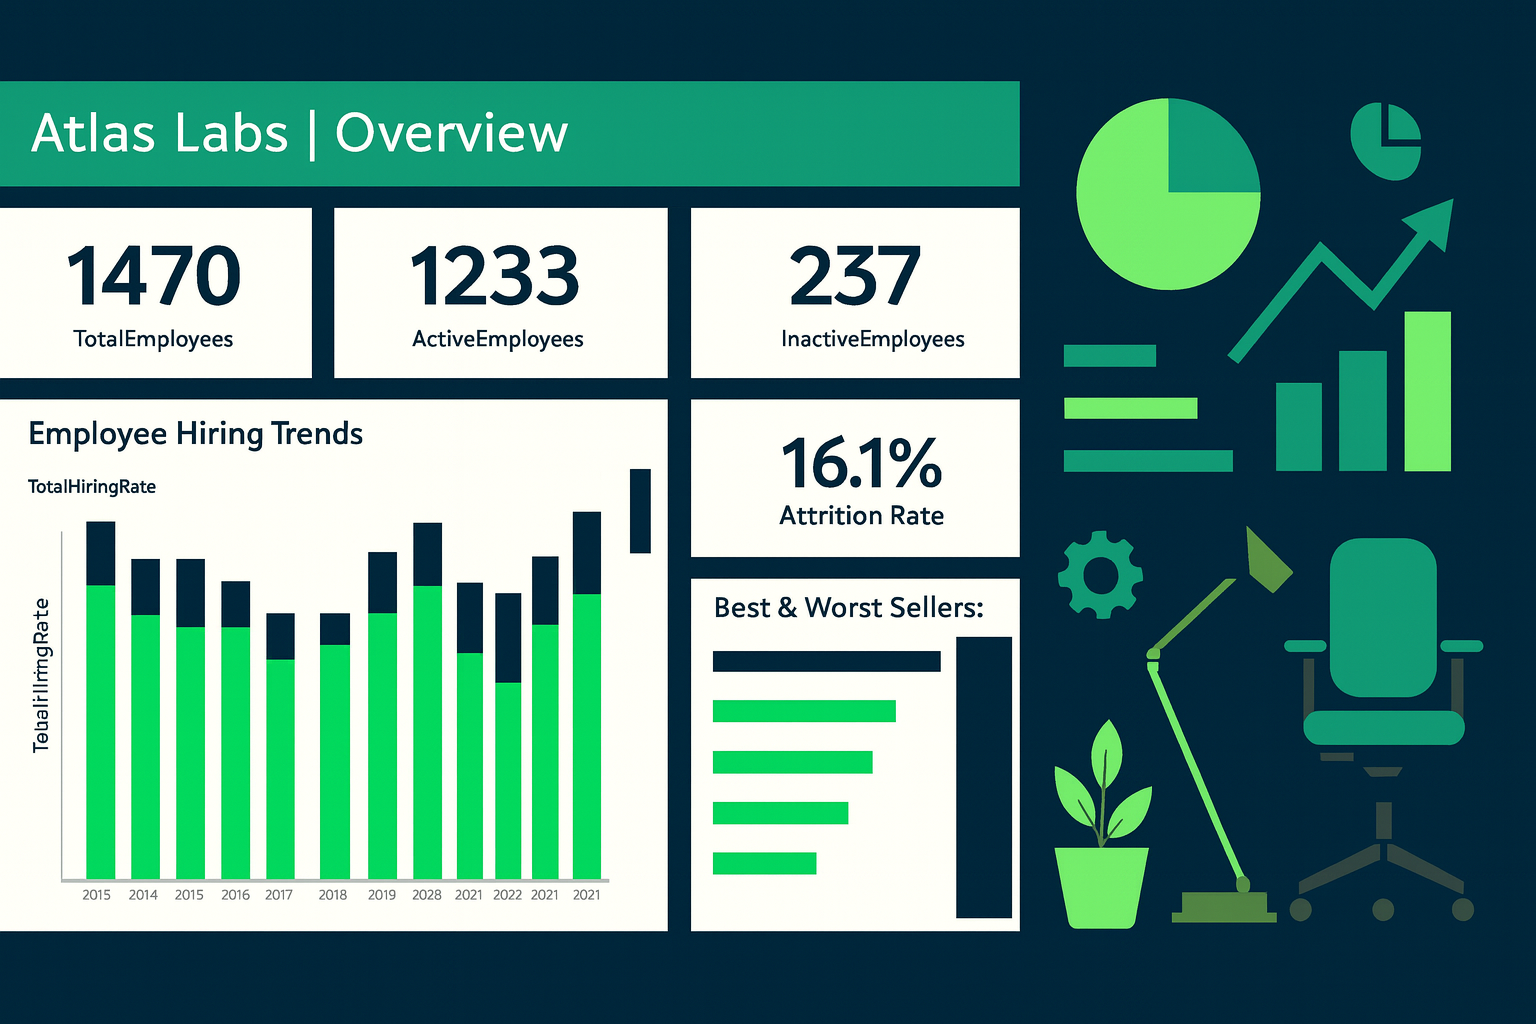
In this project I used Power BI to build an interactive HR Analytics dashboard. It provides insights into employee
demographics, performance, and attrition trends. The report includes KPIs like total employees,
active vs. inactive staff, attrition rate, and satisfaction metrics to help HR teams make
data-driven decisions
.
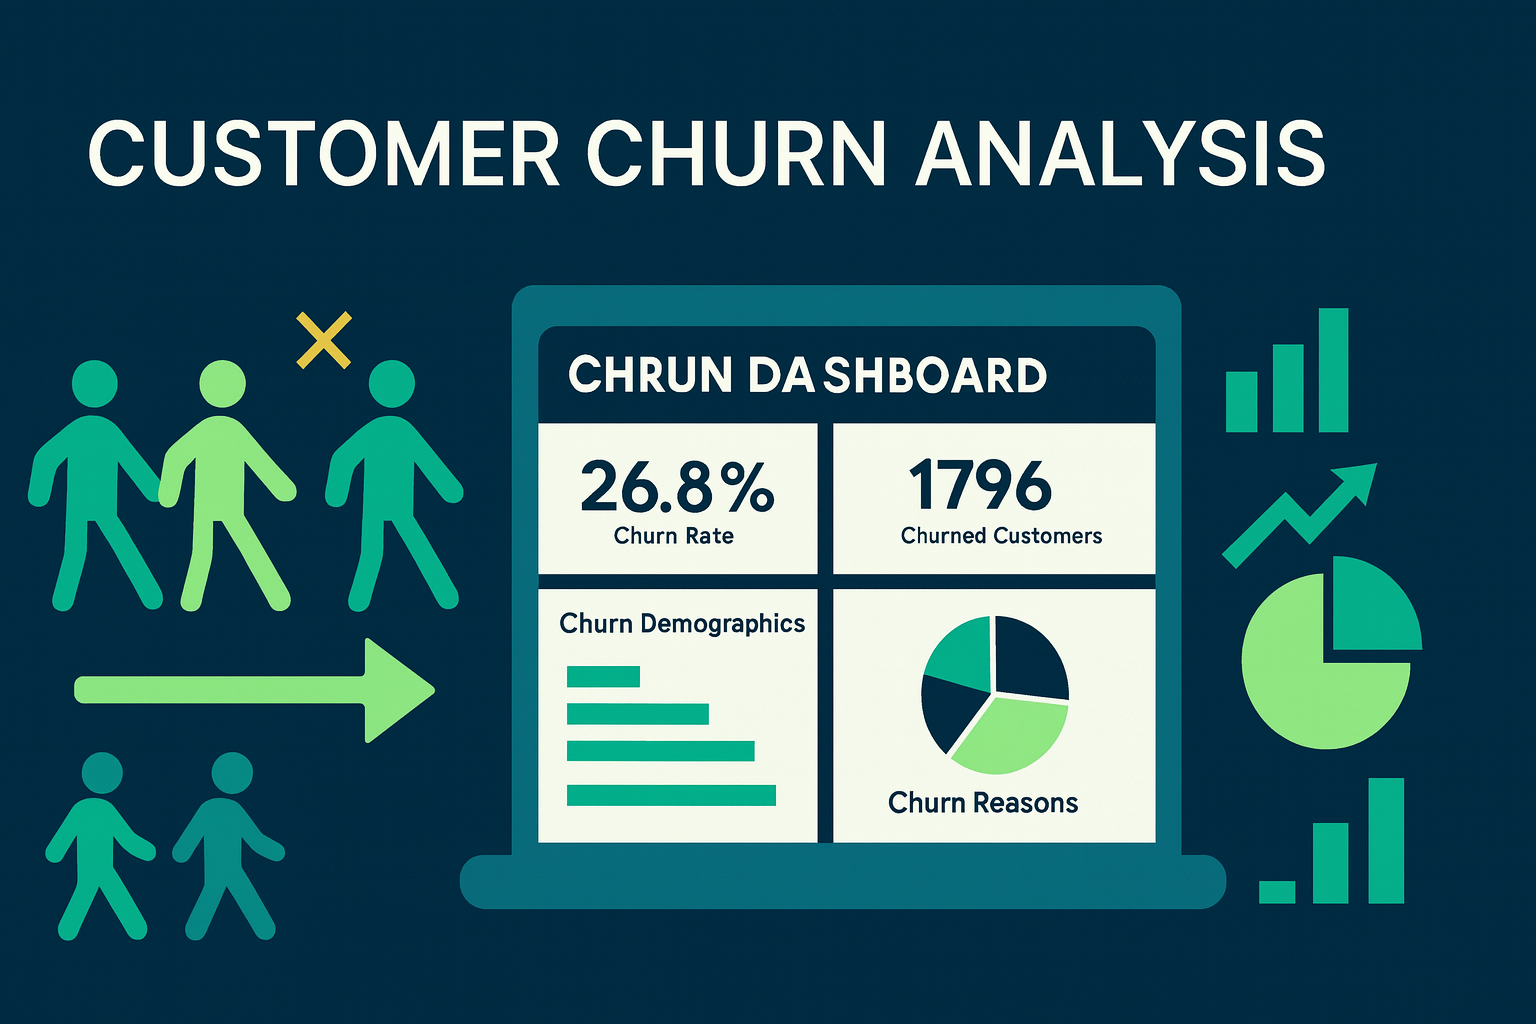
In this project I used Power BI to build an interactive dashboard analyzing customer churn data. It highlights KPIs such as overall churn rate, total churned customers, and customer demographics. The dashboard also explores churn reasons, contract types, and geographic patterns to help businesses understand customer behavior and improve retention strategies.
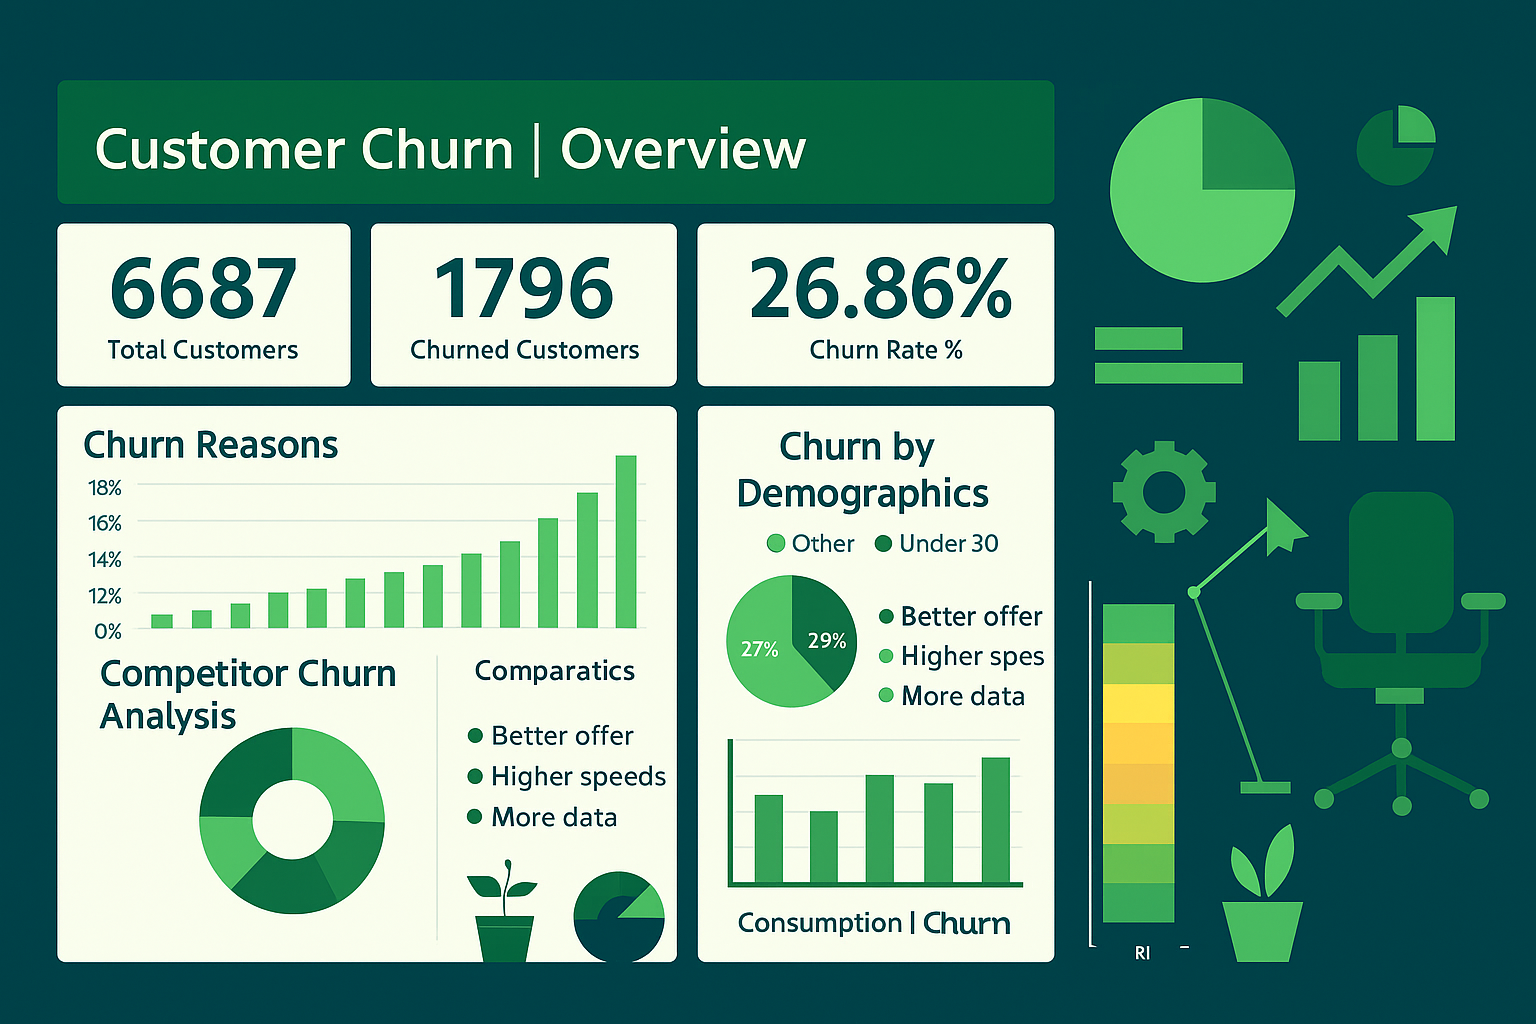
In this project I used Excel to build an interactive dashboard analyzing customer churn data. It showcases KPIs such as total customers, churned customers and overall churn rate. The dashboard also provides insights into churn reasons, age groups,
demographics, competitor analysis and geographic distribution. Helping businesses identify key drivers of churn and develop effective retention strategies..